Each one started as a real problem in a real room: a stats class, a CS lab, a weld shop. Most open in the browser with no account and nothing to install.
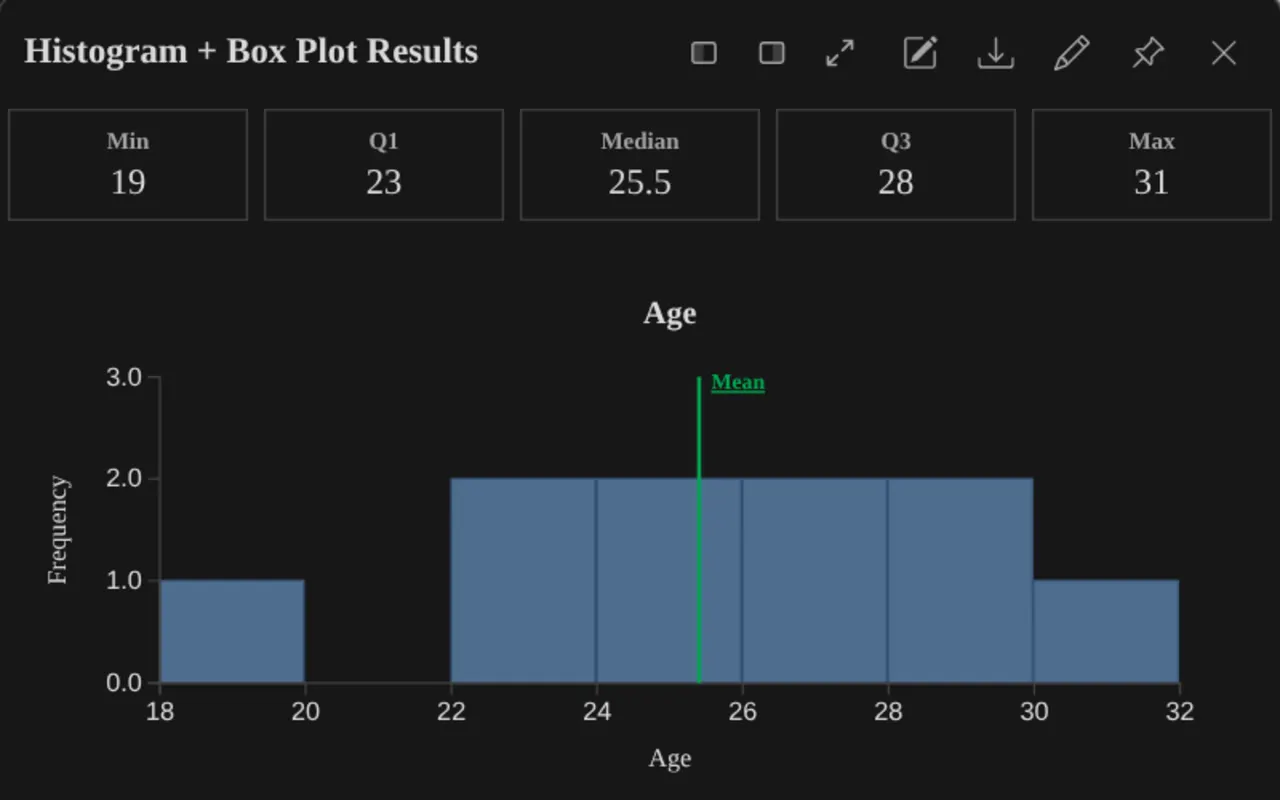
A statistics calculator for the intro course, built to replace the StatCrunch and TI-84 shuffle. A spreadsheet up front, then t-tests, ANOVA, chi-square and probability shading, and every chart redraws as the data changes. The data never leaves the student's machine.
Given: browser, D3, Cloudflare D1Open it →Liveread it, then open it.
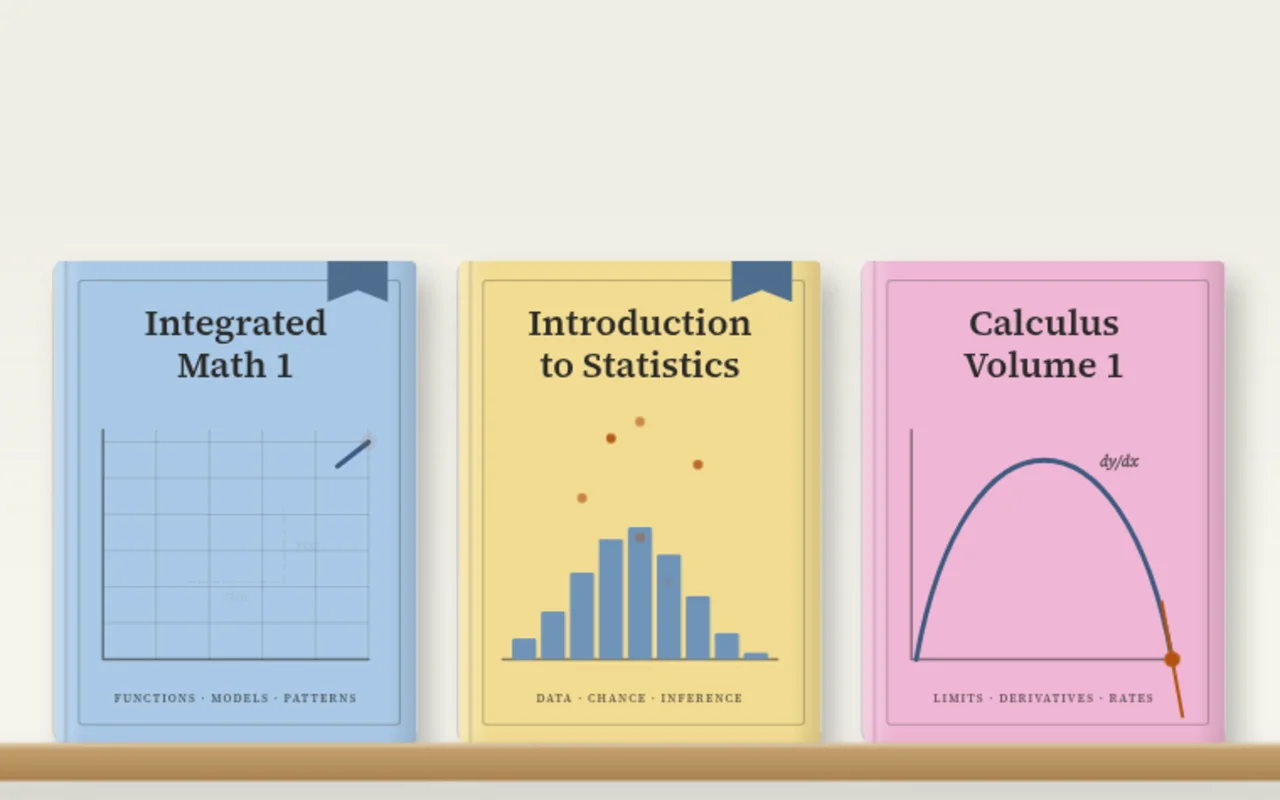
Open textbooks, rewritten for the student who actually reads them: plain-English explanations, worked examples, collapsible solutions. An 11‑step pipeline produces every page.
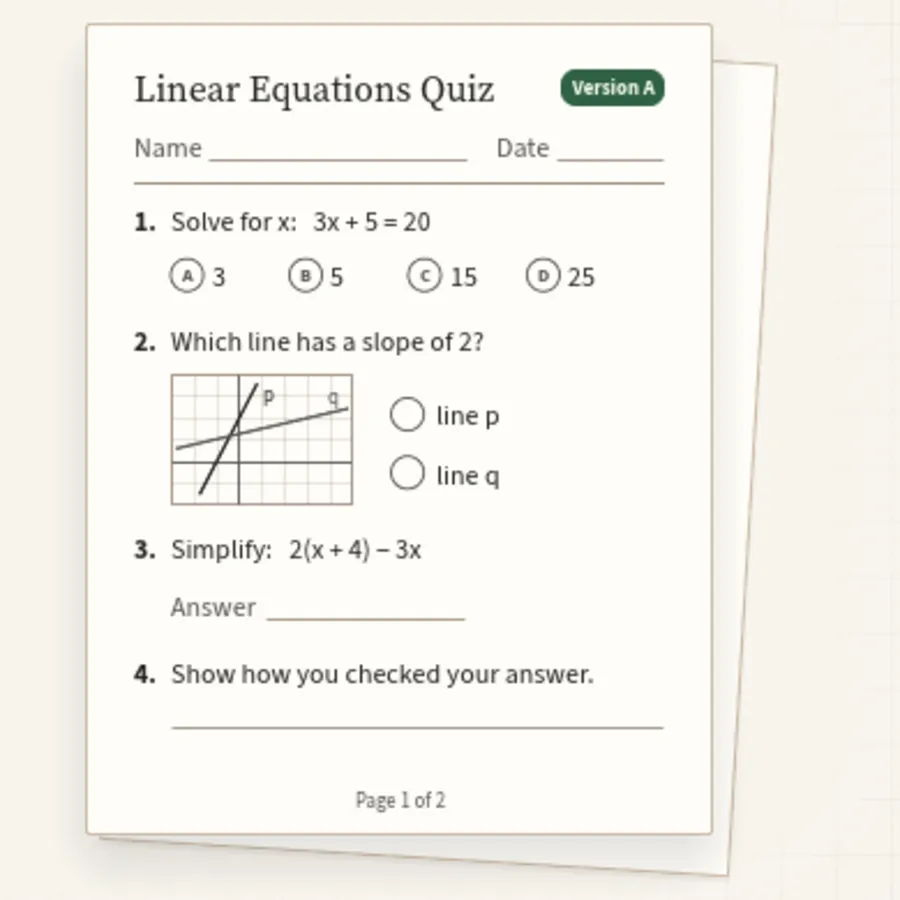
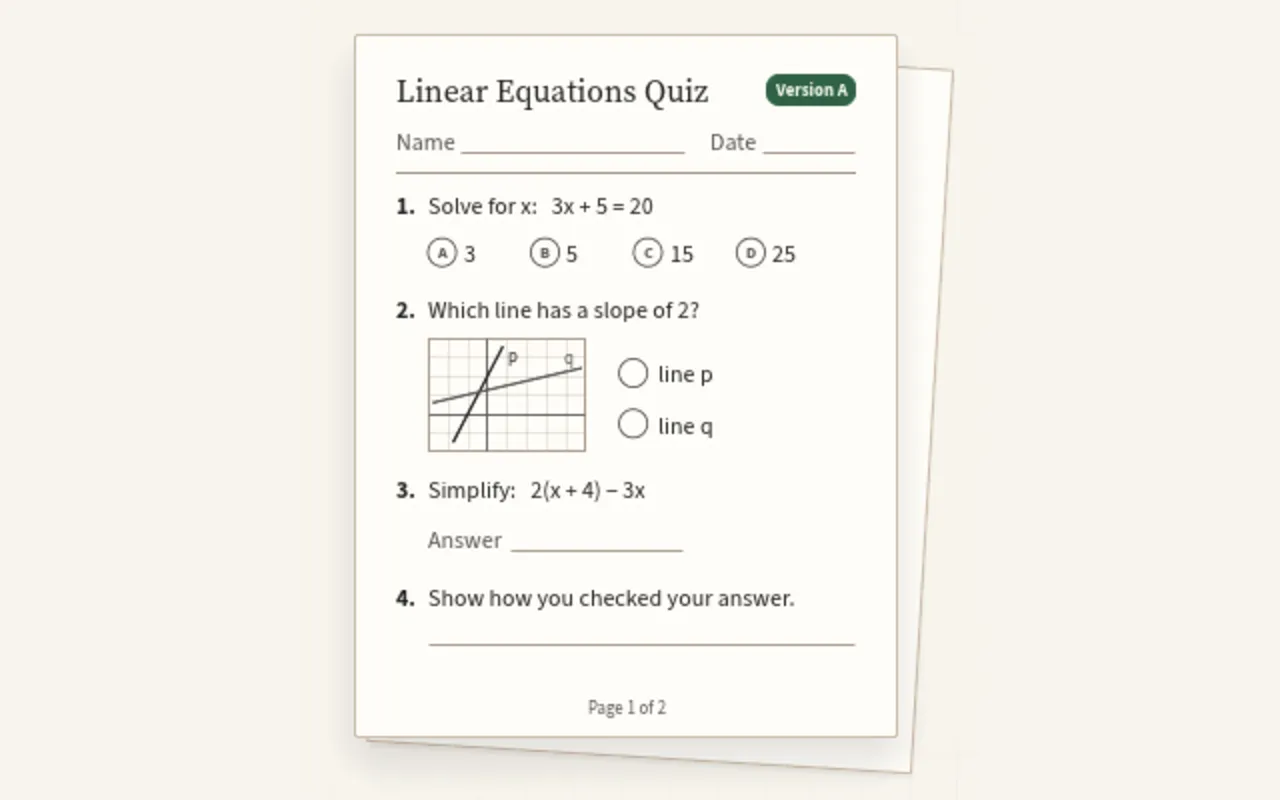
Given: 180+ sections, MathJaxOpen it →Liveversion A, version B.
Tracing paper over a coordinate grid. Plot a figure, lay the paper down, then slide it, turn it about a center you pick, or flip it over a mirror line.
Alleviate the tension between students and teachers. A forward-only set of math and reasoning problems that shows whether a student can’t start, won’t start, or doesn’t know enough yet.
Documents, spreadsheets, slides and PDFs as tabs in one window. Opens .docx, .xlsx and .pptx, with equaSHion and verSHion built in. Every app is written in Rust.
Plant ID that runs on your own server or right in the browser. Seven real models get compared head to head, and the README says plainly that 16 photos are a smoke test.
Weld settings for the machine in front of you. Pick the process, metal and thickness, and it turns the chart's targets into the number you actually dial in.